PDC 2008, Day #2, Session #4, 1 hr 15 mins
Seema Ramchandani
The final session of the day was all about optimizing graphics-based Silverlight applications. The talk was a little bit different from what I expected. I was imagining it being about how to do custom 2D graphics. Instead, it was more geared at understanding the underlying rendering loop and optimizing basic animations.
Seema is a Program Manager in the Silverlight group and described her job as being focused on performance. She is the person, she explained, that people call when they can’t figure out why their Silverlight application is running so slowly.
The Dancing Peacock
Seema’s first real-world story gives us a new term that we can use in assessing application performance:
The Dancing Peacock = the portions of your application that are consuming resources, but not contributing to the user experience in any meaningful way.
The story goes something like this. Someone called up Seema and said that they had a very poorly performing Silverlight application and they could not figure out why it was so slow. Seema took a look at it and started removing elements to understand which element was contributing to the performance degradation.
What she found, under all of the visible controls, was a giant full-screen animated dancing peacock. It was being rendered, because it was behind all of the other windows, but the designer had left it in the XAML code, figuring that it wasn’t doing any harm. But as it turns out, code to calculate all of the peacock’s dance steps was still running in the background—and dragging the entire application down.
So Seema’s basic message throughout the talk was—look for the dancing peacocks in your application and remove them.
The Graphics Pipeline
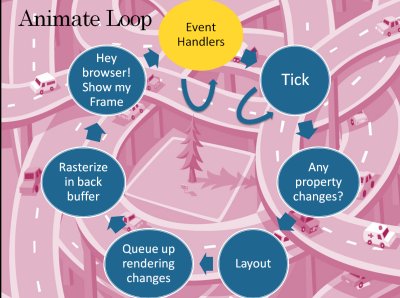
Seema argued that it was important to fully understand how the graphics pipeline in Silverlight works. If you understand the full sequence of what happens to render graphics to the screen, it can greatly help you in debugging the source of any performance problems.
She showed a fairly detailed diagram of the rendering loop and walked through all of the steps, explaining what happens at each point.
Tips / Tricks
Seema also presented miscellaneous tips and tricks for improving performance. Without going into details, some of the basic ideas were:
- Blend in as small a region as possible
- Mitigate blurry text with UsesLayoutRounding
- Avoid large-scale animations (costly)
- Don’t plug up your UI thread with costly operations
- Avoid video resizing by encoding at the desired resolution
- Simplify XAML – avoid bloat
Tools
Seema also demonstrated a very useful tool that you can use for profiling Silverlight applications. She described using a tool called XPerf, which using Event Tracing for Windows to exactly measure the amount of time spent in each module of the underlying native code.
XPerf can be used for debugging, but is most powerful as a way of comparing alternative designs, to see how they impact performance.
